PROMETHEUS
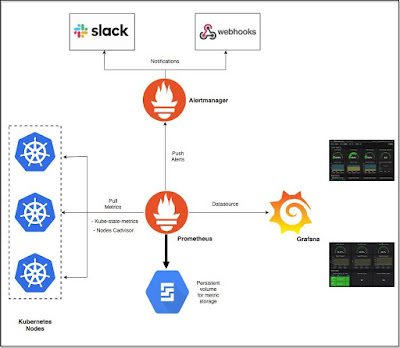
The Prometheus server works on the principle of scraping, i.e., invoking the metrics endpoints of the various nodes that it is configured to monitor. It collects these metrics at regular intervals and stores them locally. The nodes expose these over the endpoints that the Prometheus server scrapes
FEATURES OF PROMETHEUS FOR KUBERNETES
Dimensional data
Prometheus implements a highly dimensional data model. Time series are identified by a metric name and a set of key-value pairs.
Powerful queries
PromQL allows slicing and dicing of collected time series data in order to generate ad-hoc graphs, tables, and alerts.
Great visualization
Prometheus has multiple modes for visualizing data: a built-in expression browser, Grafana integration, and a console template language.
Efficient storage
Prometheus stores time series in memory and on local disk in an efficient custom format. Scaling is achieved by functional sharding and federation.
Simple operation
Each server is independent for reliability, relying only on local storage. Written in Go, all binaries are statically linked and easy to deploy.
Precise alerting
Alerts are defined based on Prometheus's flexible PromQL and maintain dimensional information. An alert manager handles notifications and silencing.
Many Integrations
Existing exporters allow bridging of third-party data into Prometheus. Examples: system statistics, as well as Docker, HAProxy, StatsD, and JMX metrics.
Many client libraries
Client libraries allow easy instrumentation of services. Over ten languages are supported already and custom libraries are easy to implement.
